What is xhprof for?
Xhprof is a PHP extension developed by facebook which helps to profile PHP sites. Although I've used the profiling capabilities of xdebug for a long time, I usually rely on xhprof now. The advantage is that it provides built-in integration into Drupal through the Devel module and can be viewed directly in the browser throgh a link displayed at the bottom of the page. With xdebug, you had to use an external tool and look for the correct profiling file to open.
How to install xhprof
See the referenced "Installing xhprof on Ubuntu" tutorial.
How to read the output provided by xhprof
Once the xhprof extension is installed, configured and enabled in the Devel settings, a link is automatically appended to every page, at the same place where Devel also displays other debugging information like required memory usage, executed queries and execution time. Clicking on it opens a long table with a lot of information that might look a bit overwhelming at the first moment.
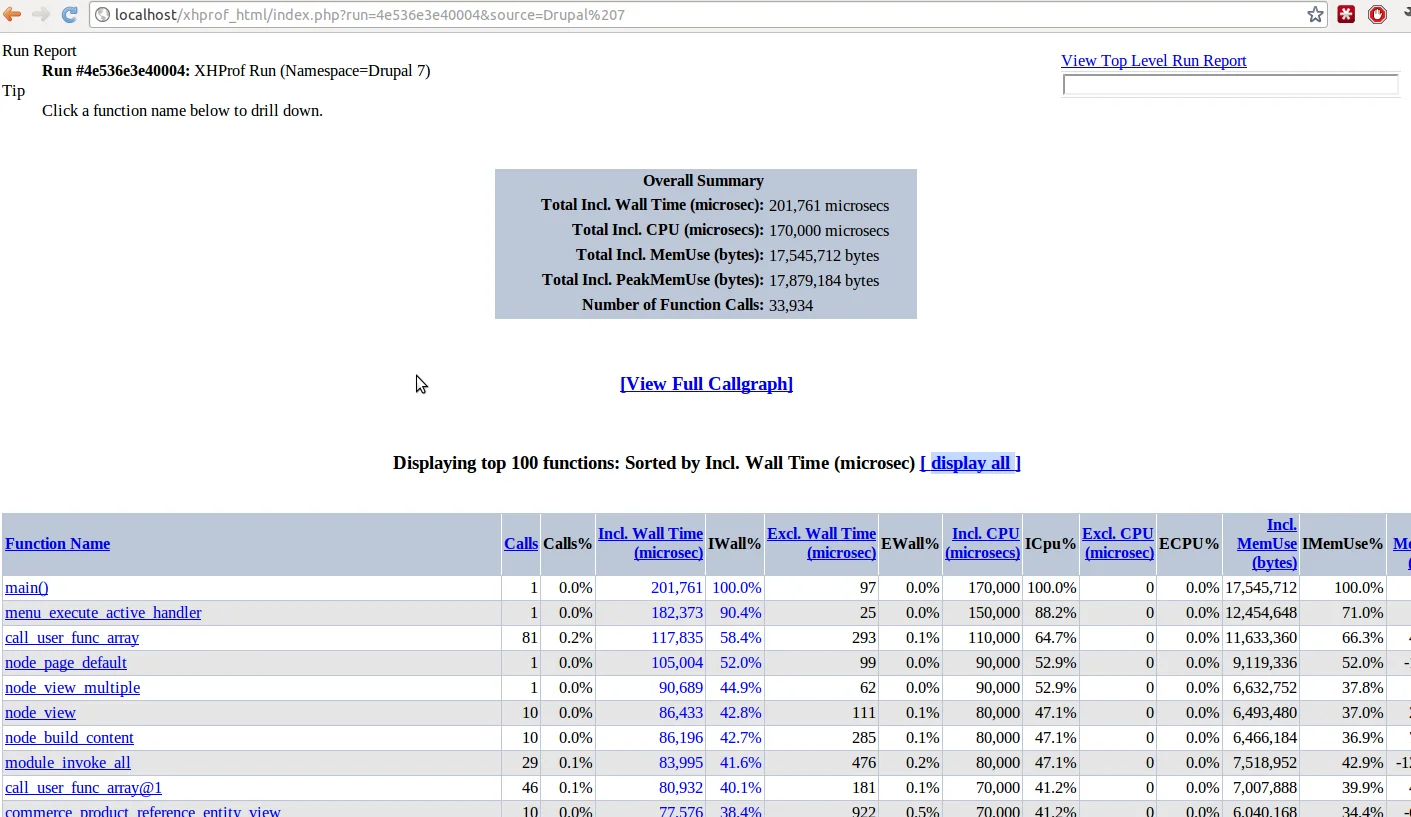
What that table contains is a list of functions executed on the page you came from, including number of calls, execution time, memory usage and more. An important thing to understand is the difference between inclusive and exclusive stats. Inclusive means that it includes time and memory consumption of functions called within that function while exclusive just shows information about that single function.
The grey block shows the combined stats of all function calls.
Look for bottlenecks
There is more you can get from that table than just finding bottlenecks, but for this tutorial, we'll concentrate on that part. The list of functions is sorted according to the inclusive execution time by default. That not very useful for us in this case. Instead, you want to click on "Excl. Wall time" to list the functions according to the time they use without their child functions.
On top, you should now see the functions which use the most time and are therefore good targets for optimizing. Note that it's not always the function itself that is the problem but could also be the function or one of the functions that is calling it. To find out more about a specific function, you can click on it.
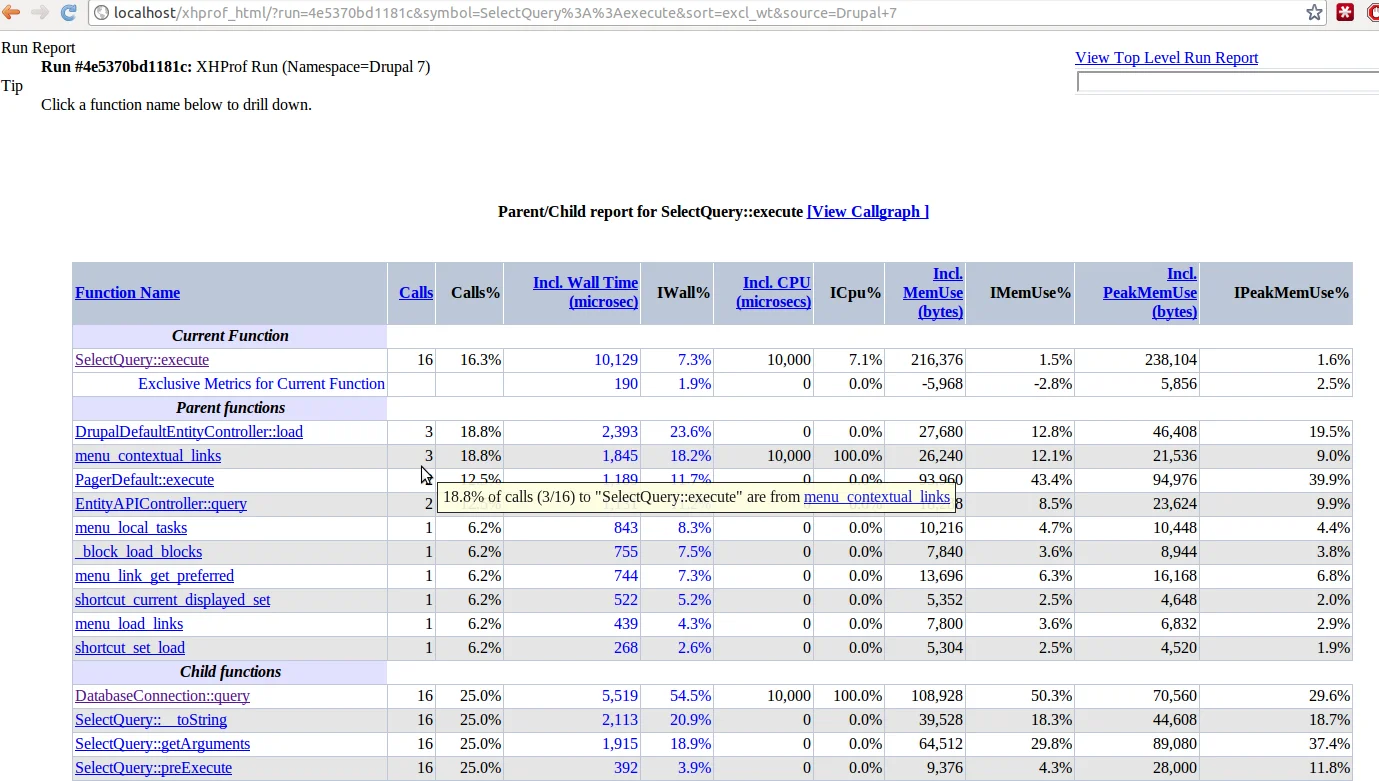
You can then see the parent and child functions and how the execution time splits between them.
Navigate through these pages until you find functions that look suspicios and then try to identify and fix the problem. A typical problem are cache_set() calls which may be caused by bugs or badly written code like variable_set() calls on every page. I'll talk more about typical patterns in a follow-up tutorial.