There are many articles out there to help you reflect on the structure of your website, in order to improve User Experience or SEO ranking. Most of them focus on rules to follow, and rather empirical decision-making processes. They are very useful, but lack a dimension about analysing the current situation of your website, and improving it.
We thus started to develop a solution allowing us to visualize the current structure of the website, this way creating a data-driven process to improve both User Experience and SEO rankings.
User experience of a website and SEO depend on many factors, such as design and page organization, but also the architecture of the website, i.e. how are the pages linked together.
This can already be assessed through the structure of the menus, but a lot of navigation can also be done through content links. There is currently no satisfying solution that allows a complete and intuitive visualization of this structure in relation with relevancy data.
Display the structure of your website in relation to relevancy data with our solution
After a first successful prototype we decided to develop a solution allowing our clients to assess the structure of their website. Because the table based approach of relational databases is not helpful to understand the bigger picture, we first map the website onto a graph database in Neo4j. This is useful because a graph allows a more intuitive visualization of the structure of the website, and of the relationships between the pages. One key advantage of using a graph Database will be the computation of the depth of pages, i.e. the minimal number of required clicks to reach a page.
Then, because Neo4j does not have suitable visualisation capabilities, we use the javascript library vis.js to visualize the networks. It simply allows us to customize the representation of the graph, to manipulate the physics of the model, and overall to make the visualization easier to understand while carrying more information.
This framework allowed us to give insights to our customers on how to improve their website’s structure, using a data-centric approach.
Our website as an example
To protect the privacy of our customers, we will use our website as an example to showcase this tool. The method provides orientation in our small website and is even more helpful in an environment with higher architectural complexity.
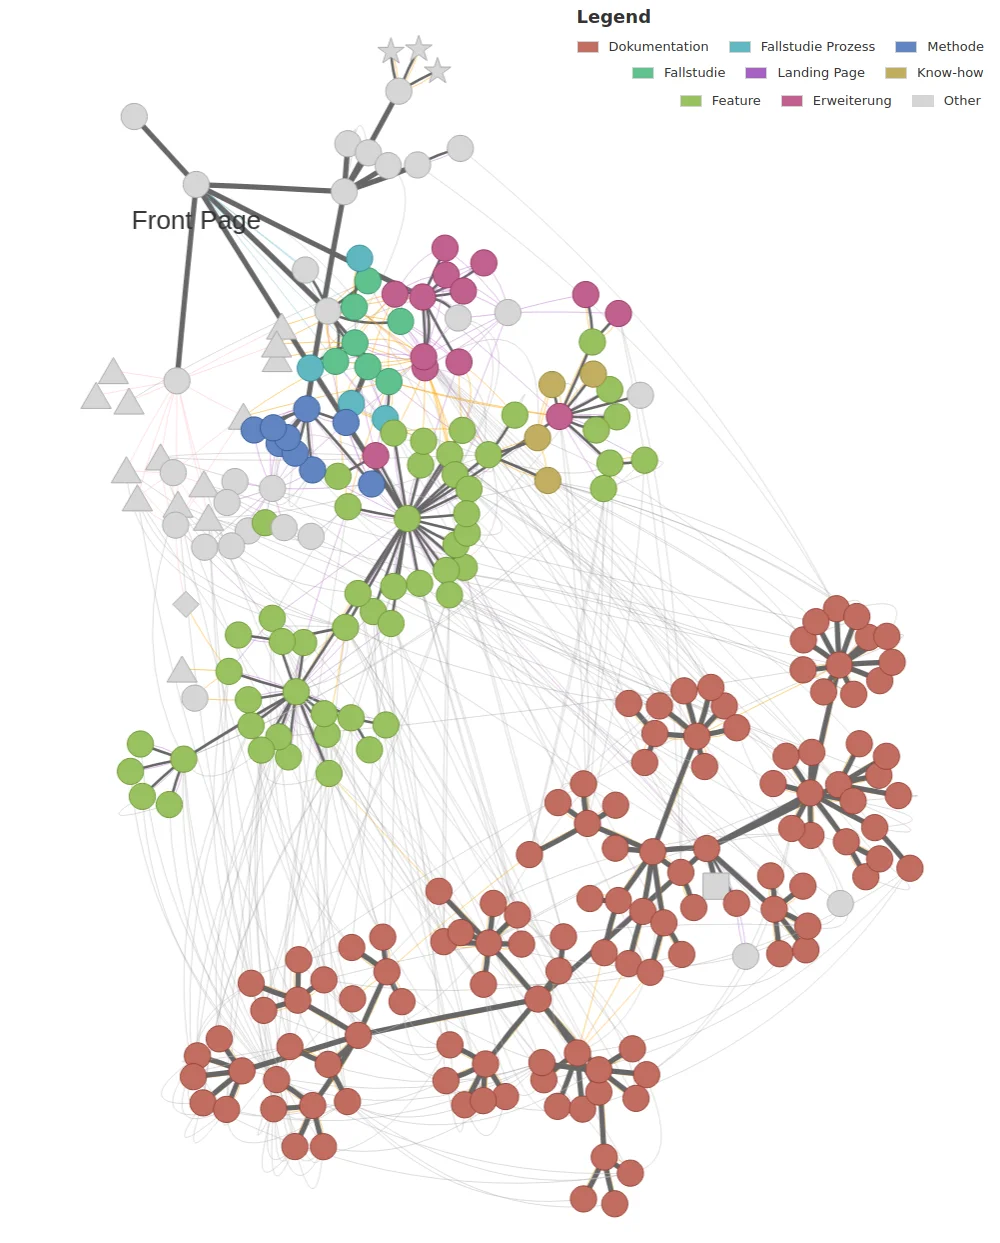
We use shapes and colors to carry information on the graph, and allow an easier orientation. For example, we can associate a type of page (belongs to the Blog, is a News article, a Profile, etc) to a color and thus recognize the semantic structures of the website. This visible structure can sometimes be associated with the various personas of the website.
In our case, the website has two main regions: the documentation, separated from the main website, which is mostly composed of our case studies, our blog and the features of our platform. We can then clearly separate the “client” from the “prospective client” personas.
It did not happen on our website because it is quite small, but on one of our customer’s bigger websites it happened that clusters of pages were not reachable at all on the website. Because the pages were still visited (probably directly from external links), it would have been impossible for our client to find out this problem without using our graph-based analysis.
Visualizing relevance data
We can adapt the size of the nodes to the number of visits at any moment in time. This allows us to detect clusters or groups of over- or under-visited nodes on the website. While Google Analytics or Matomo analytics tools do allow you to access the most visited pages, this representation has the advantage of displaying groups of related pages that have higher or lower visits. This can give more information about your users centers of interests, and help you to create content that your users will find interesting.
Visualizing page depth in relation to relevance data
Graphs are also very powerful tools to compute distance between pages, task where relational databases strongly underperform. With graphs, this can be done very efficiently, and this allows us to determine the click-depth for all pages in the website. For example in our website, this allowed us to detect that the former front page was still published - but unreachable.
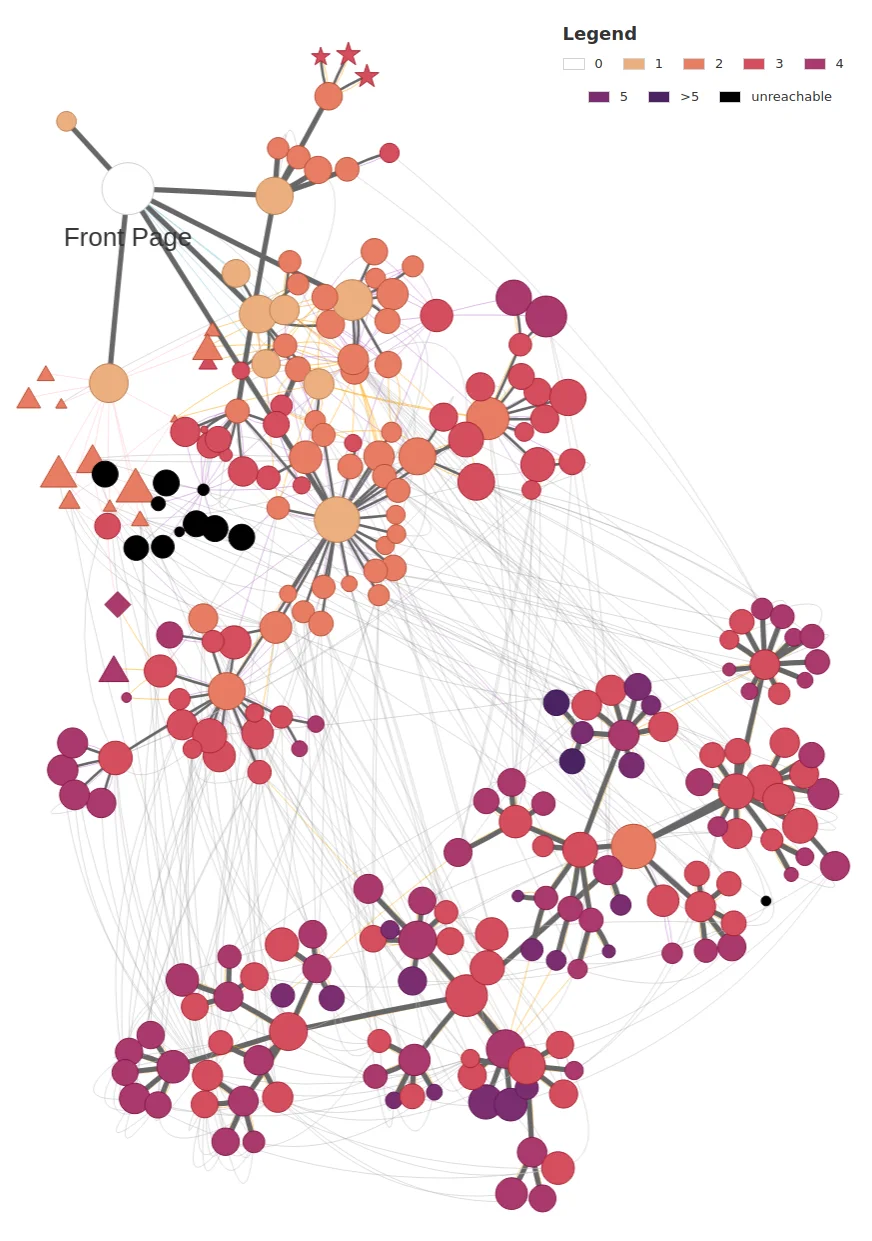
Coordinating the depth metric to the amount of visit for any page can help you detect pages with few visits that are deep in the website, making them difficult for the users to find.
In addition, it is also possible to compare visits numbers, for example between smartphone and desktop visits, compare time periods, or even find out which pages are visited through google searches compared to direct traffic.
What about me?
This solution is so far tailored to websites developed on our platform Primer, but we are working on coupling it with a crawler to enable the analysis of any website. This of course would however not allow the detection of unreachable pages, unless the interested party provides us with a list of urls to be tested.
We presented our solution to the DACH meetup last week and are grateful for the great feedback, read the presentation with more representations of our website below (in German).
If you are interested in us analysing your website, do not hesitate to contact us!